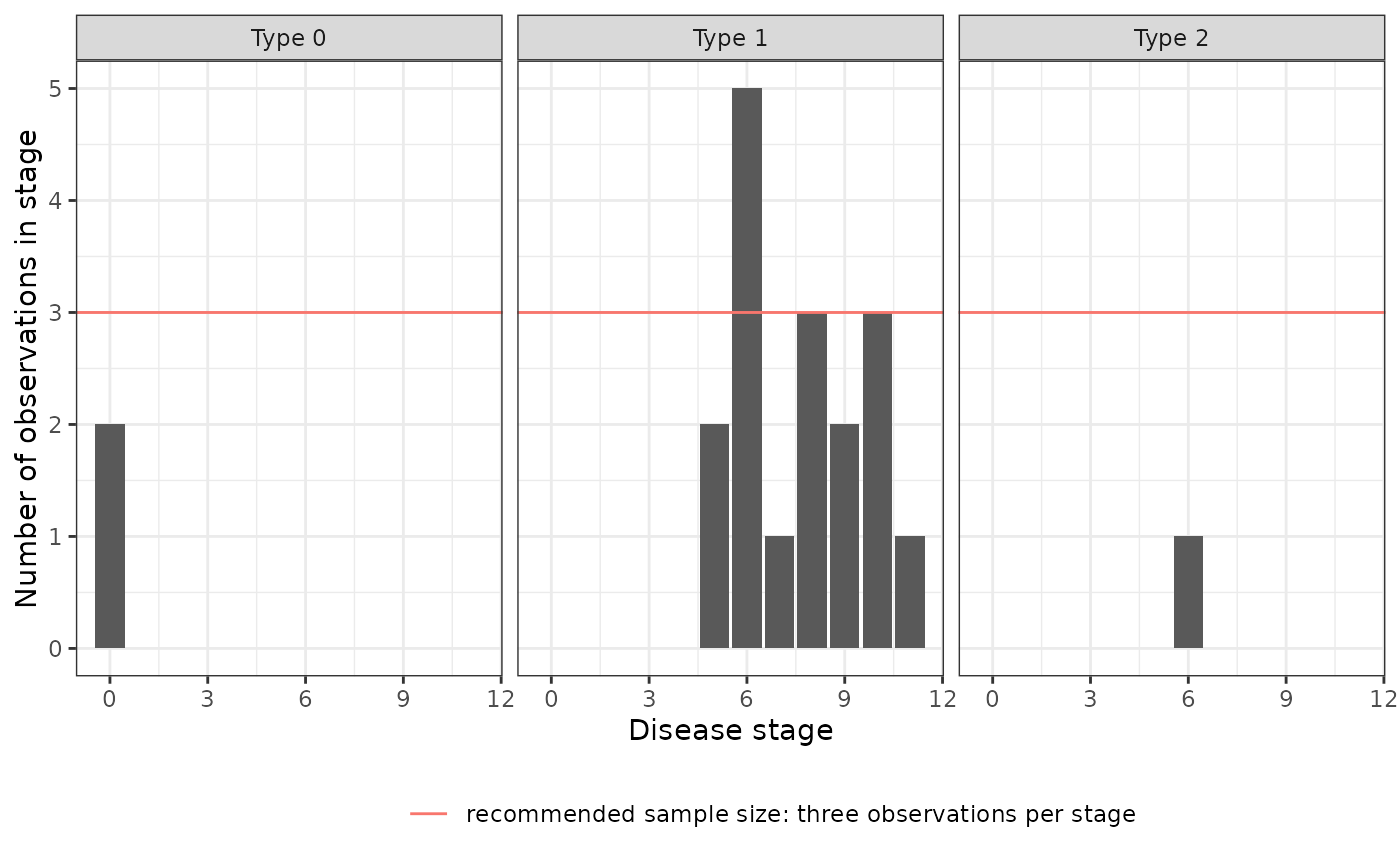
Plot estimated stage counts
Usage
# Default S3 method
stage_barplot(
  object,
  include_type_0 = TRUE,
  xmax = max(object$ml_stage, na.rm = TRUE),
  ...
)
Arguments
- object
a
subtype_and_stage_tableobject (a type of data.frame)- include_type_0
logical whether to include Type 0 in the plot
- xmax
largest x-value to display
- ...
unused
Examples
sim_subtype_and_stage_table |> stage_barplot()
