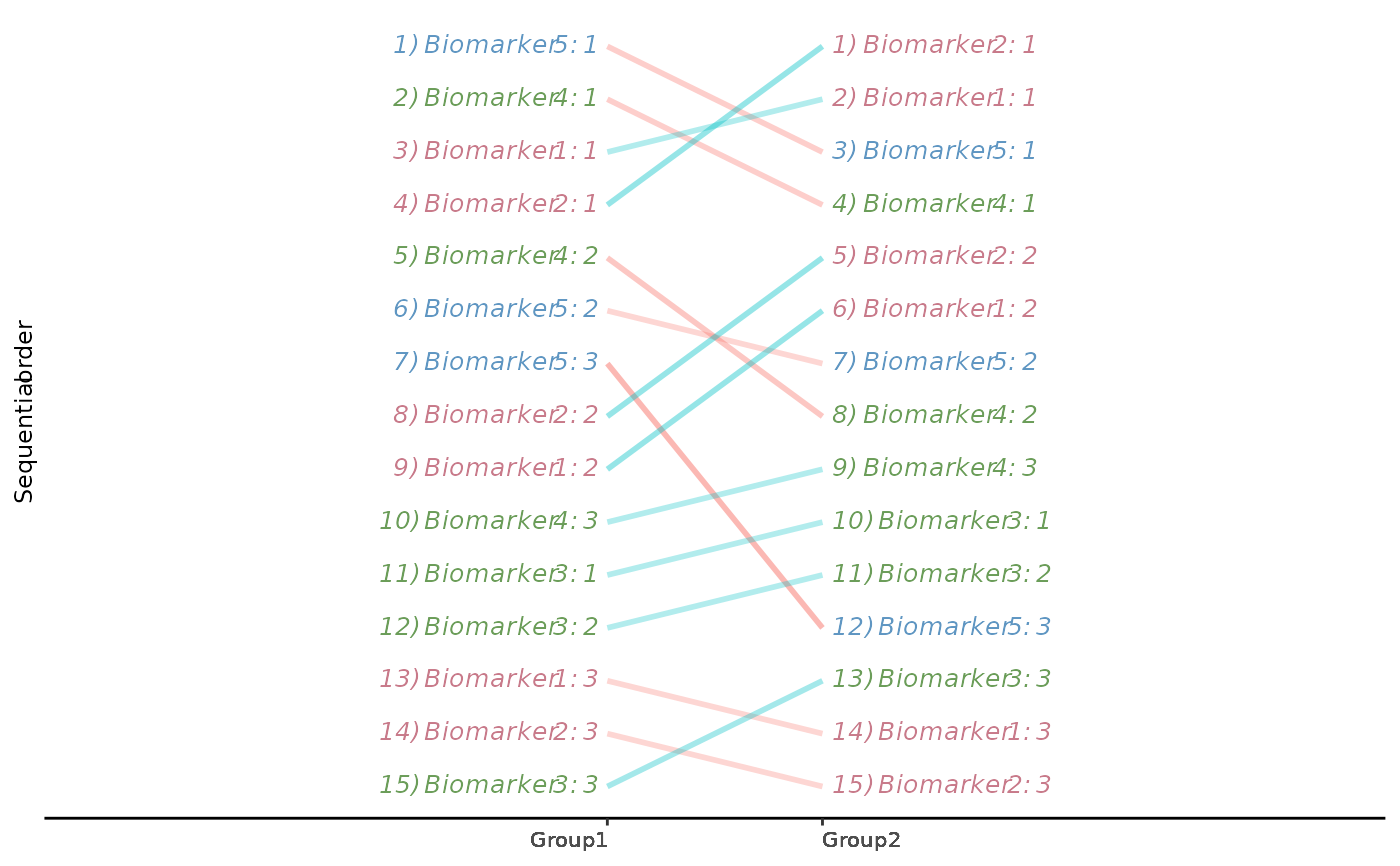
Plot change in Stage ranking
Usage
pvd_lineplot(
  figs,
  events_to_highlight = NULL,
  highlight_color = "yellow",
  min_alpha = 0.5,
  max_alpha = 1,
  stage_alpha = 1,
  facet_labels = names(figs),
  text_size = 3.4,
  y_lab = "Sequential order",
  y_title_size = 9,
  y_text_size = 8,
  x_text_size = grid::unit(8, "points"),
  nrow_group_col = 1,
  x_positions = c(1.01, 1.14),
  direction_colors = c(`(stage)` = "grey25", down = "#DC3220", neutral = "grey70", up =
    "#005AB5"),
  expand = 0,
  group_cols = group_colors(figs),
  rel_heights = c(6, 1),
  legend_text_size = grid::unit(8, "pt"),
  guide_group_colors = TRUE
)
Arguments
- figs
a list of todo
- events_to_highlight
todo
- highlight_color
todo
- min_alpha
todo
- max_alpha
todo
- stage_alpha
todo
- facet_labels
todo
- text_size
todo
- y_lab
todo
- y_title_size
todo
- y_text_size
todo
- x_text_size
todo
- nrow_group_col
integer how many rows in group_col legend
- x_positions
positions of x-axis ticks
- direction_colors
a character vector of length 4
- expand
numeric how much to pad the sides
- group_cols
a named character vector mapping from
biomarker_groupto a color palette- rel_heights
(optional) Numerical vector of relative rows heights. Works just as
rel_widthsdoes, but for rows rather than columns.- legend_text_size
grid::unit: legend text size
- guide_group_colors
logical: whether to provide a guide for group colors
Examples
output_path <-
  fs::path_package("extdata/sim_data", package = "fxtas")

figs <- extract_figs_from_pickle(
  output_folder = output_path,
  use_rds = TRUE,
  n = 3
)

figs[1:2] |> pvd_lineplot(
  group_cols = group_colors(figs)
)