Plot SuStaIn Sequential Estimate
Usage
plot_compact_pvd_est2(
  figs,
  show_uncert = TRUE,
  tile_height = 1,
  tile_width = 1,
  y_text_size = 9,
  legend = "grayscale",
  legend.position = "none",
  scale_colors = c("red", "blue", "magenta", "darkgreen", "purple4"),
  rel_heights = c(1, 0.1),
  facet_label_prefix = names(figs),
  facet_labels = compact_pvd_facet_labels(figs = figs, facet_label_prefix =
    facet_label_prefix),
  facet_label_size = 9,
  vjust = 1.5,
  ...
)
Arguments
- figs
todo
- show_uncert
Show the uncertainty in the sequential order. Logical.
- tile_height
todo
- tile_width
todo
- y_text_size
integer: size of y-axis text
- legend
"grayscale" or "color"
- legend.position
the default position of legends ("none", "left", "right", "bottom", "top", "inside")
- scale_colors
todo
- rel_heights
relative heights of the plot and the legend
- facet_label_prefix
todo
- facet_labels
facet labels
- facet_label_size
integer: font size for cowplot facet labels
- vjust
vjust for cowplot labels
- ...
arguments passed to
tmp_func()
Examples
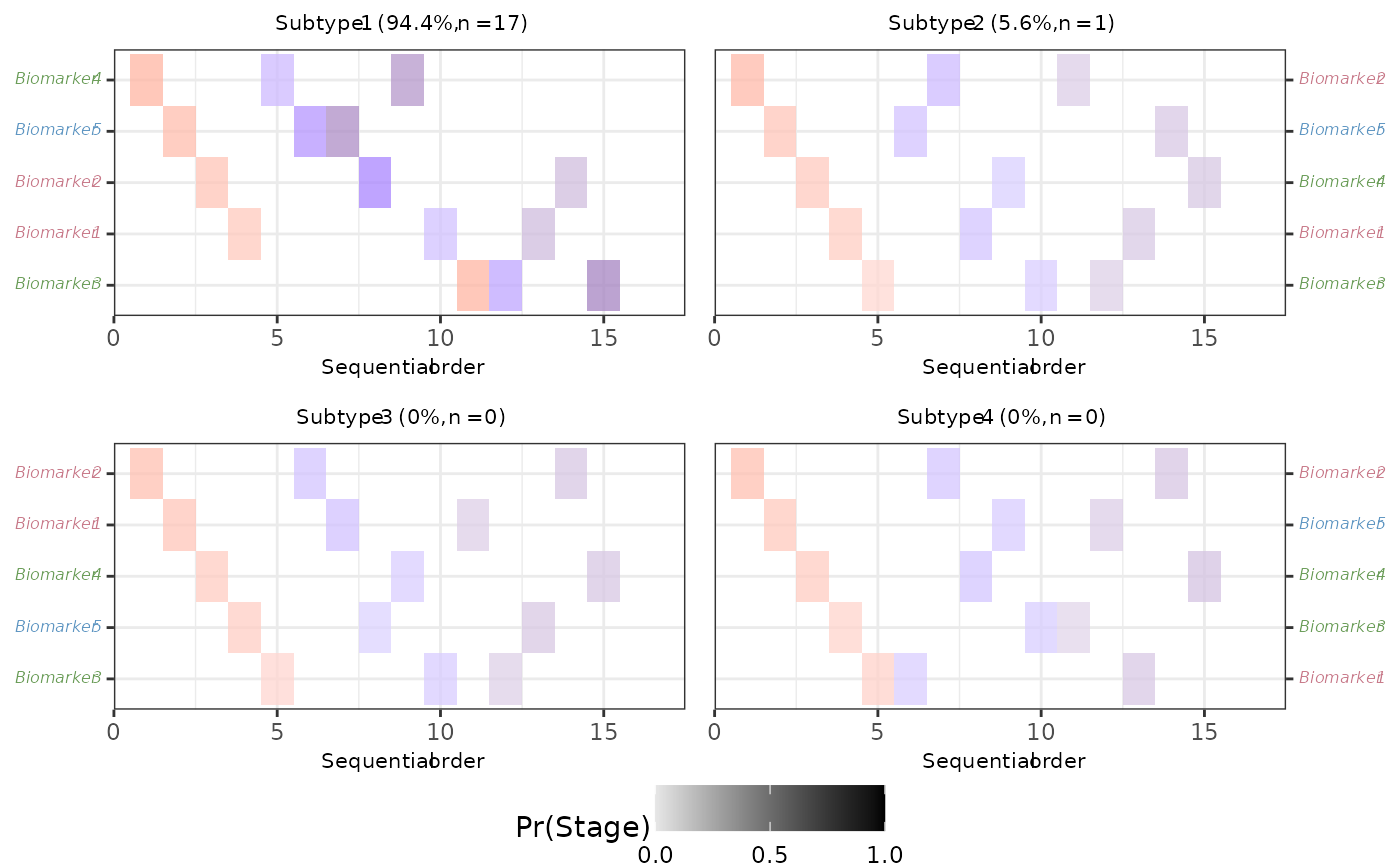
figs <- extract_figs_from_pickle(
  n_s = 4,
  dataset_name = "sample_data",
  output_folder = fs::path_package("fxtas", "extdata/sim_data/"),
  use_rds = TRUE
)

plot_compact_pvd_est2(
  figs = figs,
  tile_height = 1,
  y_text_size = 6,
  title_size = 8
)