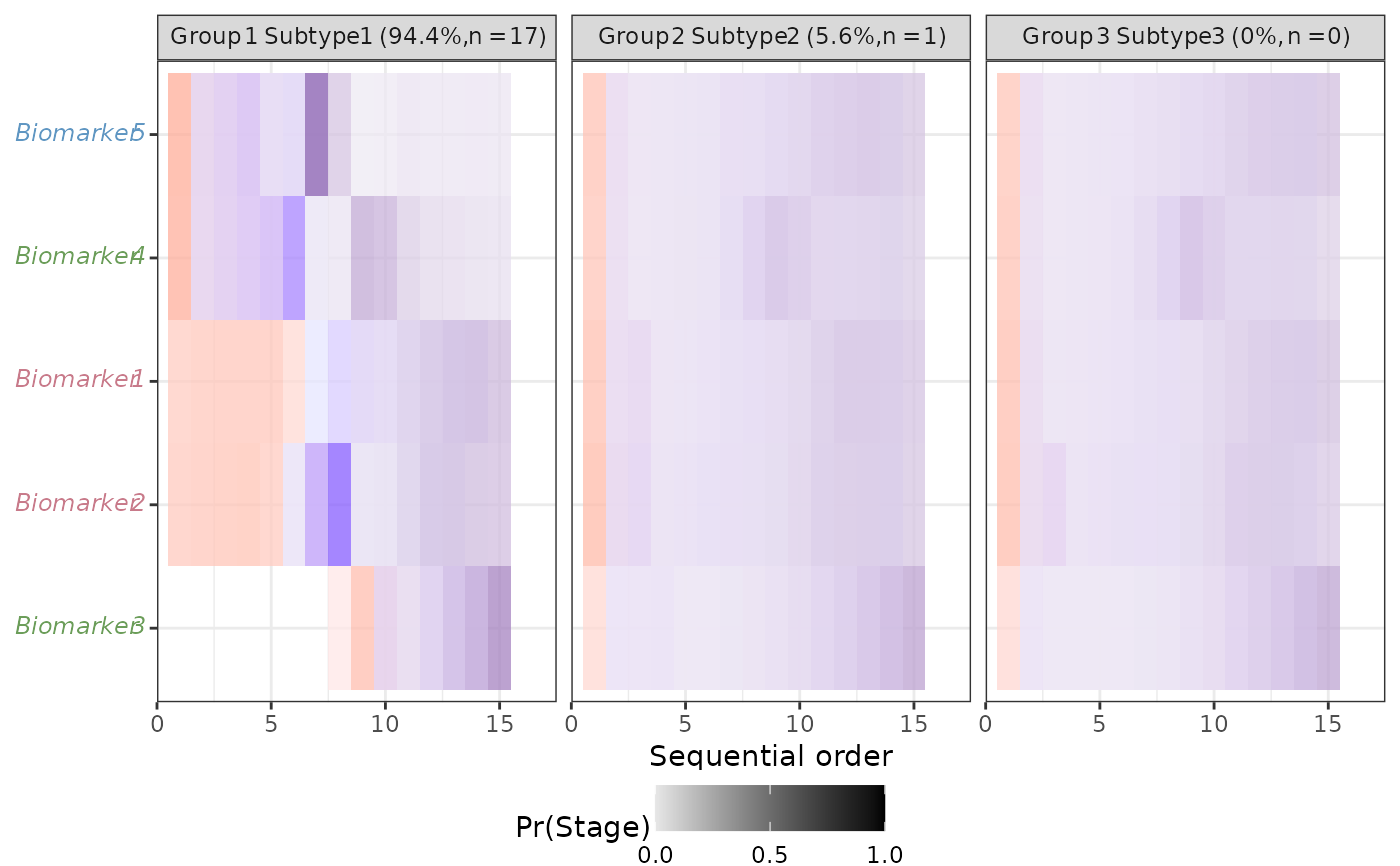
Plot compact PVD tmp function using list of extract_figs_from_pickle
Source:R/plot_compact_pvd.R
plot_compact_pvd.RdPlot compact PVD tmp function using list of extract_figs_from_pickle
Usage
plot_compact_pvd(
  figs,
  tile_height = 1,
  y_text_size = 9,
  x_text_size = y_text_size,
  x_title_size = x_text_size,
  facet_label_prefix = names(figs),
  legend.position = "right",
  legend.direction = "vertical",
  legend.box = "vertical",
  legend.key.height = grid::unit(1, "lines"),
  colorbar_label_type = "level",
  scale_colors = c("red", "blue", "magenta", "darkgreen", "purple4"),
  rel_heights = c(1, 0.025),
  ncol_legend = 2,
  nrow_colors = dplyr::if_else(legend.position == "none", 2, 1),
  guide_rel_widths = c(0.7, 0.3),
  legend_text_size = grid::unit(8, "pt"),
  show_group_color_legend = TRUE,
  strip_text_size = grid::unit(8, "points"),
  ...
)
Arguments
- figs
todo
- tile_height
todo
- y_text_size
integer: size of y-axis text
- x_text_size
integer: size of x-axis tick labels
- x_title_size
integer: size of x-axis title
- facet_label_prefix
todo
- legend.position
the default position of legends ("none", "left", "right", "bottom", "top", "inside")
- legend.direction
layout of items in legends ("horizontal" or "vertical")
- legend.box
arrangement of multiple legends ("horizontal" or "vertical")
- legend.key.height
size of legend keys (unit); key background height & width inherit from legend.key.size or can be specified separately. In turn legend.key.size inherits from spacing.
- colorbar_label_type
what kind of label to use? Current options are
"level"and"subscript"- scale_colors
todo
- rel_heights
(optional) Numerical vector of relative rows heights. Works just as
rel_widthsdoes, but for rows rather than columns.- ncol_legend
how many columns to use for legend
- nrow_colors
now many rows to use for color guide
- guide_rel_widths
relative widths of guides
- legend_text_size
grid::unit: legend text size
- show_group_color_legend
logical: whether to show group col legend
- strip_text_size
passed to
ggtext::element_markdown()- ...
Arguments passed on to
compact_pvd_data_prepbiomarker_ordera character vector specifying the order of biomarkers to use
biomarker_vareither "biomarker" or "biomarker_label"
Examples
output_path <-
  fs::path_package("extdata/sim_data", package = "fxtas")

figs <- extract_figs_from_pickle(
  output_folder = output_path,
  n = 3
)

figs |> plot_compact_pvd(scale_colors = c("red", "blue", "purple4"))